- Current Valley Market Snapshot
- What 4.5 Months of Supply Means
- How to Gauge Your Home Specifically
- What the 18% Pending Ratio Suggests
- What This Means for Your Price Range
- So, Who Has the Advantage Right Now?
- Common Seller Questions
- All Data
The Greater Phoenix Valley (The Valley) housing market is clearly not one-sided so far in 2026. It is not the kind of market where every reasonably priced home gets fast and meaningful attention, but it’s also not a market where sellers have no leverage.
The better answer is that The Valley is currently a more selective and buyer-sensitive market. Sellers can still succeed, but buyers have more room to compare homes, negotiate, and pass on listings that are overpriced or ill-prepared.
This is an important distinction because broad labels like “buyer’s market” or “seller’s market” are too simple for the current market. A seller in a lower price range may experience the market very differently than a seller with a higher-end home. A well-priced home in strong condition may still draw solid interest off the bat, while a similar home priced too high may sit.
Current Valley Market Snapshot
(See the full market snapshot in the ‘All Data’ section.)
4.5 months supply of inventory
18% pending ratio
97.8% average sale-to-final-list-price ratio
94.9% average sale-to-original-list-price ratio
These numbers point to a market where homes are in fact moving, but not instantly and not without skill or a knowledgeable entry to the market.
Buyers have options and sellers have to compete, meaning pricing strategy matters more than it would in a low-inventory market.
What 4.5 Months of Supply Means
Months supply measures how long it would take to sell through current inventory at the recent pace of sales if no new listings came on the market.
At 4.5 months of supply for the Valley, it is not extremely tight. In a true “buyer’s market” you would see more inventory and in a seller’s market you see less.
This suggests a more balanced environment where sellers are not powerless but buyers have options.
In a market like this, it is the sellers who put themselves in the best position to win by pricing smart, hiring experts, and having those experts educate them and negotiate for them, that get results.
How to Gauge Your Home Specifically
For a homeowner, a big mistake is assuming the market label answers your personal decision.
A “buyer’s market” does not mean no one should sell and a “seller’s market” does not mean every home will sell instantly or at the original asking price. The real question is how your home fits the market buyers are currently seeing and what are the costs or benefits of waiting?
Sellers should consider things like:
How many similar homes are active in my area?
Is pending activity strong in my price range?
Can my list price be defended by current demand?
If you’re trying to understand if this market can work in your favor, the broad label only takes you so far. You can request a local opinion here.
What the 18% Pending Ratio Suggests
The pending ratio compares pending listings (listings with an accepted offer) to active listings. Here, pending listings equal about 18% of active listings.
That does not mean only 18% of homes will sell but it does suggest active inventory is meaningfully larger than the number of homes currently under contract.
Put simply, buyers are choosing, not chasing.
What This Means for Your Price Range
The market appears to behave differently based on price range.
A supplemental review of the data shows a stronger pending ratio below $500k and a weaker pending ratio above $1M.
The breakdown is this:
Under $500k ~26.1% pending ratio
$500k – $1M ~22.9% pending ratio
$1M+ ~16.5% pending ratio
So a closer look at the data actually reveals that sellers at different price points will experience the market differently. This is why being educated is a crucial component to hitting the market with confidence.
Price range is not the only factor, of course. But for a seller under $500k, the market may feel more active if the home is priced well and compares favorably than a seller above $1M. Price range can change how much leverage a seller has.
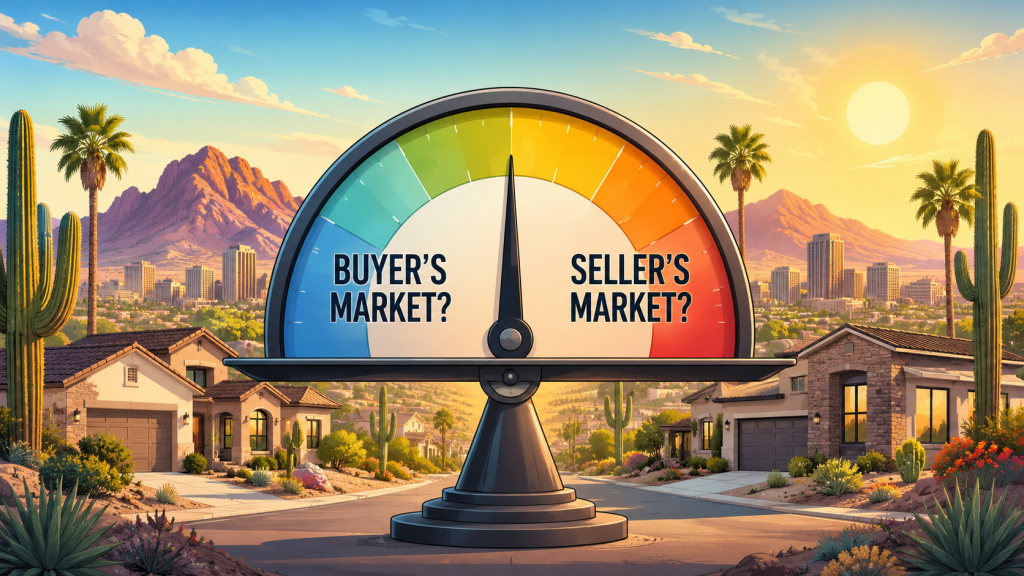
So, Who Has the Advantage Right Now?
Broadly, buyers have more leverage than they’ve been used to in recent history. They have more listings to compare, more time to evaluate, and more room to negotiate.
But sellers still have leverage when the home is well-positioned.
Hence the importance of working with someone who can properly position a home in the current market.
So the practical answer is: The Valley market is giving buyers more room to be selective, but it still rewards sellers who price and prepare correctly.
If you’d like to talk to an expert in positioning or just have some questions, click here and we’ll get you connected. They’ll be happy to help.
Common Seller Questions
Can you get good results selling in this market?
Yes, but sellers (or their agents) need to be more skilled and prepared. Keeping a home at its best possible positioning for its entire duration on the market is easier said than done and who you work with matters.
Should sellers price high and negotiate down?
That is risky in a more selective market. The gap between sale-to-final-list price and sale-to-original-list price suggests original pricing matters. Starting too high can cost time and may lead to worse results. This strategy is not recommended. See more on original price vs final outcome here.
Is the market the same across the whole Valley?
No. Greater Phoenix includes many different cities, ZIP codes, property types, and price ranges. Averages are useful, but they can hide key differences between submarkets.
All Data
29,015 active listings
5,222 pending listings
18% pending ratio
4.5 months supply of inventory
89 average days on market for active listings
62 median days on market for active listings
55 median days on market for sold listings
97.8% average sale-to-final-list-price ratio
94.9% average sale-to-original-list-price ratio
$450,000 median sold price
$479,000 median active list price
Market data in this article is based on Greater Phoenix / Phoenix Valley residential market activity provided for review, including active listings, pending listings, months supply, days on market, pricing metrics, and sale-to-list-price ratios. Supplemental MLS export analysis was used to identify directional price-range patterns across active and pending listings for single-family homes and condo/townhome-style properties. Export-based observations should be treated as illustrative, not as a complete market-wide conclusion. Market conditions change, and individual results depend on location, property type, condition, price range, competition, and seller timeline. Any estimate or selling range is informational only, is not an appraisal, and is not a guaranteed sale price. Actual results depend on property condition, comparable sales, buyer demand, financing terms, concessions, timing, negotiation, and other factors